CapitalLusaka
LanguagesBemba, Nyanja, Tonga, Lozi, Chewa, Nsenga, Tumbuka, Lunda, Kaonde, Lala, Lamba, English, Luvale, Mambwe, Namwanga, Lenje, Bisa, other, unspecified
CurrencyZambian kwacha
Governmentpresidential republic
Bamwor Indexes
Zambia — Q1 2026
IBEUBamwor Urban Scale Index
10.05%
Rank #156 of 237
View full ranking →
IBCPBamwor Population Concentration Index
18.77%
Rank #168 of 237
View full ranking →
IBDABamwor Settlement Density Index
17.11per 1K km²
Rank #193 of 241
View full ranking →
IBCXBamwor Country Complexity Index
67.06/100
Rank #67 of 234
View full ranking →
IBEEBamwor Economic Stability Index
81.04/100
Rank #183 of 220
View full ranking →
IBFMBamwor Military Strength Index
49.82/100
Rank #72 of 124
View full ranking →
IBDIBamwor Digital Infrastructure Index
49.18/100
Rank #169 of 206
View full ranking →
IBEDBamwor Education Index
48.51/100
Rank #94 of 119
View full ranking →
IBSABamwor Healthcare Index
57.37/100
Rank #179 of 218
View full ranking →
Zambia Intelligence Report
Download PDF with 20+ statistics, rankings & proprietary indices
Introduction
Background
Bantu-speaking groups mainly from the Luba and Lunda Kingdoms in the Congo River Basin and from the Great Lakes region in East Africa settled in what is now Zambia beginning around A.D. 300, displacing and mixing with previous population groups in the region. The Mutapa Empire developed after the fall of Great Zimbabwe to the south in the 14th century and ruled the region, including large parts of Zambia, from the 14th to 17th century. The empire collapsed as a result of the growing slave trade and Portuguese incursions in the 16th and 17th centuries. The region was further influenced by migrants from the Zulu Kingdom to the south and the Luba and Lunda Kingdoms to the north, after invading colonial and African powers displaced local residents into the area around the Zambezi River, in what is now Zambia. In the 1880s, British companies began securing mineral and other economic concessions from local leaders. The companies eventually claimed control of the region and incorporated it as the protectorate of Northern Rhodesia in 1911. The UK took over administrative control from the British South Africa Company in 1924. During the 1920s and 1930s, advances in mining spurred British economic ventures and colonial settlement.
Northern Rhodesia’s name was changed to Zambia upon independence from the UK in 1964, under independence leader and first President Kenneth KAUNDA. In the 1980s and 1990s, declining copper prices, economic mismanagement, and a prolonged drought hurt the economy. Elections in 1991 brought an end to one-party rule and propelled the Movement for Multiparty Democracy (MMD) into power. The subsequent vote in 1996, however, saw increasing harassment of opposition parties and abuse of state media and other resources. Administrative problems marked the election in 2001, with three parties filing a legal petition challenging the election of ruling party candidate Levy MWANAWASA. MWANAWASA was reelected in 2006 in an election that was deemed free and fair. Upon his death in 2008, he was succeeded by his vice president, Rupiah BANDA, who won a special presidential byelection later that year. BANDA and the MMD lost to Michael SATA and the Patriotic Front (PF) in the 2011 general elections. SATA, however, presided over a period of haphazard economic management and attempted to silence opposition to PF policies. SATA died in 2014 and was succeeded by his vice president, Guy SCOTT, who served as interim president until 2015, when Edgar LUNGU won the presidential byelection and completed SATA's term. LUNGU then won a full term in the 2016 presidential elections. Hakainde HICHILEMA was elected president in 2021.
Geography
Area
land
743,398 sq km
water
9,220 sq km
total
752,618 sq km
Climate
tropical; influenced by altitude; rainy season from October to April
Terrain
predominantly a high plateau interspersed with hills and mountains
Land use
other
7.3% (2023 est.)
forest
60.6% (2023 est.)
agricultural land
32.1% (2023 est.)
agricultural land: arable land
arable land: 5.1% (2023 est.)
agricultural land: permanent crops
permanent crops: 0.1% (2023 est.)
agricultural land: permanent pasture
permanent pasture: 26.9% (2023 est.)
Location
located in Southern Africa, to the east of Angola and south of the Democratic Republic of the Congo
Coastline
0 km (landlocked)
Elevation
lowest point
Zambezi river 329 m
highest point
Mafinga Central 2,330 m
mean elevation
1,138 m
Irrigated land
1,560 sq km (2012)
Major aquifers
Upper Kalahari-Cuvelai-Upper Zambezi Basin
Map references
Africa
Land boundaries
total
6,043.15 km
border countries
Angola 1,065 km; Botswana 0.15 km; Democratic Republic of the Congo 2,332 km; Malawi 847 km; Mozambique 439 km; Namibia 244 km; Tanzania 353 km; Zimbabwe 763 km
Maritime claims
none (landlocked)
Natural hazards
occasional drought; tropical storms occurring between November and April
Geography - note
landlocked; the Zambezi River serves as a natural boundary with Zimbabwe; Lake Kariba, situated on the Zambia-Zimbabwe border, is the largest reservoir globally by volume (180 cu km; 43 cu mi)
Natural resources
copper, cobalt, zinc, lead, coal, emeralds, gold, silver, uranium, hydropower
Area - comparative
nearly five times the area of Georgia; slightly exceeds the size of Texas
Geographic coordinates
15 00 S, 30 00 E
Population distribution
features one of the highest urbanization rates in Africa; high population density in the central region, especially in cities like Lusaka, Ndola, Kitwe, and Mufulira, as depicted in the population distribution map
Major lakes (area sq km)
fresh water lake(s)
Lake Tanganyika (shared with the Democratic Republic of Congo, Tanzania, and Burundi) - 32,000 sq km; Lake Mweru (shared with the Democratic Republic of Congo) - 4,350 sq km; Lake Bangweulu - 4,000-15,000 sq km depending on seasonal changes
Major watersheds (area sq km)
Indian Ocean drainage
Zambezi (1,332,412 sq km)
Atlantic Ocean drainage
Congo (3,730,881 sq km)
Major rivers (by length in km)
Congo River source (shared with Angola, Republic of Congo, and Democratic Republic of Congo [m]) - 4,700 km; Zambezi River source (shared with Angola, Namibia, Botswana, Zimbabwe, and Mozambique [m]) - 2,740 km
note: [s] following the country name indicates the river source; [m] following the country name indicates the river mouth
People & Society
Literacy
male
81.7% (2018 est.)
female
62.2% (2018 est.)
total population
71.1% (2018 est.)
Languages
Bemba 33.4%, Nyanja 14.7%, Tonga 11.4%, Lozi 5.5%, Chewa 4.5%, Nsenga 2.9%, Tumbuka 2.5%, Lunda (North Western) 1.9%, Kaonde 1.8%, Lala 1.8%, Lamba 1.8%, English (official) 1.7%, Luvale 1.5%, Mambwe 1.3%, Namwanga 1.2%, Lenje 1.1%, Bisa 1%, other 9.7%, unspecified 0.2% (2010 est.)
Religions
Protestant 75.3%, Roman Catholic 20.2%, others 2.7% (which includes Muslim, Buddhist, Hindu, and Baha'i), none 1.8% (2010 estimate).
Sex ratio
at birth
1.03 male(s)/female
0-14 years
1.02 male(s)/female
15-64 years
1 male(s)/female
total population
1 male(s)/female (2024 est.)
65 years and over
0.82 male(s)/female
Birth rate
29.6 births/1,000 population (2025 est.)
Death rate
4.91 deaths/1,000 population (2025 est.)
Median age
male
18.2 years
total
19 years (2025 est.)
female
18.6 years
Population
male
11,066,079
total
22,021,971 (2025 est.)
female
10,955,892
Nationality
noun
Zambian(s)
adjective
Zambian
Tobacco use
male
21.4% (2025 est.)
total
11.7% (2025 est.)
female
2.4% (2025 est.)
Urbanization
urban population
46.3% of total population (2023)
rate of urbanization
4.15% annual rate of change (2020-25 est.)
Age structure
0-14 years
42.1% (male 4,418,980/female 4,337,187)
15-64 years
55.1% (male 5,726,265/female 5,736,732)
65 years and over
2.8% (2024 est.) (male 262,008/female 317,944)
Ethnic groups
Bemba 21%, Tonga 13.6%, Chewa 7.4%, Lozi 5.7%, Nsenga 5.3%, Tumbuka 4.4%, Ngoni 4%, Lala 3.1%, Kaonde 2.9%, Namwanga 2.8%, Lunda (north Western) 2.6%, Mambwe 2.5%, Luvale 2.2%, Lamba 2.1%, Ushi 1.9%, Lenje 1.6%, Bisa 1.6%, Mbunda 1.2%, other 13.8%, unspecified 0.4% (2010 est.)
Child marriage
men married by age 18
2.8% (2018)
women married by age 15
5.2% (2018)
women married by age 18
29% (2018)
Dependency ratios
total dependency ratio
75.8 (2025 est.)
youth dependency ratio
71.3 (2025 est.)
potential support ratio
22.3 (2025 est.)
elderly dependency ratio
4.5 (2025 est.)
Physician density
0.32 physicians/1,000 population (2022)
Health expenditure
Health expenditure (as % of GDP)
6.6% of GDP (2021)
Health expenditure (as % of national budget)
8.9% of national budget (2022 est.)
Net migration rate
0.4 migrant(s)/1,000 population (2025 est.)
Total fertility rate
3.67 children born/woman (2025 est.)
Drinking water source
improved: rural
rural: 51.1% of population (2022 est.)
improved: total
total: 68.2% of population (2022 est.)
improved: urban
urban: 88.6% of population (2022 est.)
unimproved: rural
rural: 48.9% of population (2022 est.)
unimproved: total
total: 31.8% of population (2022 est.)
unimproved: urban
urban: 11.4% of population (2022 est.)
Education expenditure
Education expenditure (% GDP)
4.1% of GDP (2023 est.)
Education expenditure (% national budget)
14.5% national budget (2025 est.)
Infant mortality rate
male
38.9 deaths/1,000 live births
total
30.1 deaths/1,000 live births (2025 est.)
female
32.1 deaths/1,000 live births
Population growth rate
2.51% (2025 est.)
Gross reproduction rate
1.81 (2025 est.)
Population distribution
Zambia exhibits one of the highest urbanization rates in Africa; notable population density is concentrated in the central region, especially in the cities of Lusaka, Ndola, Kitwe, and Mufulira, as illustrated in the population distribution map.
Life expectancy at birth
male
65.2 years
female
68.7 years
total population
66.9 years (2024 est.)
Maternal mortality ratio
85 deaths/100,000 live births (2023 est.)
Sanitation facility access
improved: rural
rural: 40.9% of population (2022 est.)
improved: total
total: 57.9% of population (2022 est.)
improved: urban
urban: 78.1% of population (2022 est.)
unimproved: rural
rural: 59.1% of population (2022 est.)
unimproved: total
total: 42.1% of population (2022 est.)
unimproved: urban
urban: 21.9% of population (2022 est.)
Alcohol consumption per capita
beer
1.26 liters of pure alcohol (2019 est.)
wine
0.04 liters of pure alcohol (2019 est.)
total
3.82 liters of pure alcohol (2019 est.)
spirits
0.36 liters of pure alcohol (2019 est.)
other alcohols
2.16 liters of pure alcohol (2019 est.)
Major urban areas - population
3.181 million LUSAKA (capital), 763,000 Kitwe (2023)
Obesity - adult prevalence rate
8.1% (2016)
Mother's mean age at first birth
19.2 years (2018 est.)
Currently married women (ages 15-49)
55.7% (2018 est.)
Children under the age of 5 years underweight
11.8% (2018 est.)
Environment
Climate
tropical; influenced by elevation; wet season (October to April)
Land use
other
7.3% (2023 est.)
forest
60.6% (2023 est.)
agricultural land
32.1% (2023 est.)
agricultural land: arable land
arable land: 5.1% (2023 est.)
agricultural land: permanent crops
permanent crops: 0.1% (2023 est.)
agricultural land: permanent pasture
permanent pasture: 26.9% (2023 est.)
Urbanization
urban population
46.3% of total population (2023)
rate of urbanization
4.15% annual rate of change (2020-25 est.)
Waste and recycling
municipal solid waste generated annually
2.608 million tons (2024 est.)
percent of municipal solid waste recycled
12.6% (2022 est.)
Environmental issues
air contamination and acid precipitation in the mineral mining and processing area; chemical runoff affecting watersheds; decline in biodiversity; illegal hunting; deforestation; soil degradation; desertification; insufficient water purification
Total water withdrawal
municipal
290 million cubic meters (2022 est.)
industrial
130 million cubic meters (2022 est.)
agricultural
1.152 billion cubic meters (2022 est.)
Carbon dioxide emissions
total emissions
9.877 million metric tonnes of CO2 (2023 est.)
from coal and metallurgical coke
4.835 million metric tonnes of CO2 (2023 est.)
from petroleum and other liquids
5.042 million metric tonnes of CO2 (2023 est.)
Particulate matter emissions
16.1 micrograms per cubic meter (2019 est.)
Total renewable water resources
104.8 billion cubic meters (2022 est.)
International environmental agreements
party to
Biodiversity, Climate Change, Climate Change-Kyoto Protocol, Climate Change-Paris Agreement, Comprehensive Nuclear Test Ban, Desertification, Endangered Species, Hazardous Wastes, Law of the Sea, Nuclear Test Ban, Ozone Layer Protection, Wetlands
signed, but not ratified
none of the selected agreements
Government
Flag
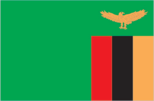
description: a green field featuring a prominent orange eagle in the upper-right section; beneath the eagle is a panel divided into three vertical bands colored red (on the left), black, and orange
meaning: the green symbolizes the nation's natural resources and flora, red signifies the fight for independence, black represents the citizens, and orange denotes the country’s mineral riches; the eagle embodies the populace's capacity to overcome national challenges
Capital
name
Lusaka
etymology
named after a village with a headman (chief) called LUSAAKAS
time difference
UTC+2 (7 hours ahead of Washington, DC, during Standard Time)
geographic coordinates
15 25 S, 28 17 E
Suffrage
18 years of age; universal
Citizenship
citizenship by birth
only if at least one parent is a citizen of Zambia
citizenship by descent only
yes, if at least one parent holds Zambian citizenship
dual citizenship recognized
yes
residency requirement for naturalization
5 years for individuals with a Zambian ancestor, otherwise a 10-year residency is mandatory
Constitution
history
multiple prior versions; the most recent was adopted on 24 August 1991 and promulgated on 30 August 1991
amendment process
introduced by the National Assembly; to be approved, a two-thirds majority vote from the Assembly is necessary in two distinct readings spaced at least 30 days apart; amendments concerning fundamental rights and freedoms require the consent of over half of the votes in a referendum before the Assembly can consider and vote on them
Country name
former
Northern Rhodesia
etymology
the name originates from the Zambezi River, which flows through the western region of the nation and delineates the southern boundary with Zimbabwe
conventional long form
Republic of Zambia
conventional short form
Zambia
Independence
24 October 1964 (from the UK)
Legal system
a mixed legal system that incorporates English common law and customary law
Government type
presidential republic
Judicial branch
highest court(s)
Supreme Court (comprising the chief justice, deputy chief justice, and a minimum of 11 judges); Constitutional Court (composed of the court president, vice president, and 11 judges)
subordinate courts
Court of Appeal; High Court; Industrial Relations Court; subordinate courts (three levels, determined by the monetary limit involved); Small Claims Court; local courts (two tiers, based on the monetary limit involved)
judge selection and term of office
judges of the Supreme Court and Constitutional Court are appointed by the president of the republic based on the recommendations of the 9-member Judicial Service Commission, chaired by the chief justice, and are confirmed by the National Assembly; judges typically serve until the age of 65
Executive branch
cabinet
Cabinet appointed by president from among members of the National Assembly
chief of state
President Hakainde HICHILEMA (since 24 August 2021)
election results
2021: Hakainde HICHILEMA elected president; percentage of the vote - Hakainde HICHILEMA (UPND) 57.9%, Edgar LUNGU (PF) 37.3%, others 4.8%
2016: Edgar LUNGU reelected as president; percentage of vote - Edgar LUNGU (PF) 50.4%, Hakainde HICHILEMA (UPND) 47.6%, others 2%; note - the president serves as both the chief of state and head of government
head of government
President Hakainde HICHILEMA (since 24 August 2021)
most recent election date
12 August 2021
election/appointment process
the president is elected directly through an absolute-majority popular vote, which may require two rounds if necessary, for a term of 5 years (eligible for re-election for a second term)
expected date of next election
2026
National holiday
Independence Day, 24 October (1964)
National color(s)
green, red, black, orange
National heritage
total World Heritage Sites
1 (natural)
selected World Heritage Site locales
Mosi-oa-Tunya/Victoria Falls
Political parties
Alliance for Democracy and Development or ADD
Forum for Democracy and Development or FDD
Movement for Multiparty Democracy or MMD
Party of National Unity and Progress or PNUP
Patriotic Front or PF
United Party for National Development or UPND
Legislative branch
term in office
5 years
number of seats
167 (156 directly elected; 8 appointed)
electoral system
plurality/majority
legislature name
National Assembly
scope of elections
full renewal
legislative structure
unicameral
most recent election date
44420
expected date of next election
August 2026
percentage of women in chamber
15%
parties elected and seats per party
United Party for National Development (UPND) (82); Patriotic Front (PF) (60); Independents (13); Other (1)
National anthem(s)
title
"Lumbanyeni Zambia" (Stand and Sing of Zambia, Proud and Free)
history
adopted in 1964; the melody is derived from the widely recognized song "God Bless Africa," which is a popular anthem throughout southern Africa
lyrics/music
multiple/Enoch Mankayi SONTONGA
National symbol(s)
African fish eagle
Administrative divisions
comprises 10 provinces: Central, Copperbelt, Eastern, Luapula, Lusaka, Muchinga, Northern, North-Western, Southern, and Western
Diplomatic representation in the US
FAX
[1] (202) 332-0826
chancery
2200 R Street NW, Washington, DC 20008
telephone
[1] (202) 234-4009
chief of mission
Ambassador Chibamba KANYAMA (since 30 June 2023)
email address and website
[email protected]
https://www.zambiaembassy.org/
Diplomatic representation from the US
FAX
[260] (0) 211-357-224
embassy
Eastern end of Kabulonga Road, Ibex Hill, Lusaka
telephone
[260] (0) 211-357-000
mailing address
2310 Lusaka Place, Washington DC 20521-2310
chief of mission
Ambassador Michael C. GONZALES (in office since 16 September 2022)
email address and website
[email protected]
https://zm.usembassy.gov/
International organization participation
ACP, AfDB, AU, C, COMESA, EITI (compliant country), FAO, G-77, IAEA, IBRD, ICAO, ICCt, ICRM, IDA, IFAD, IFC, IFRCS, ILO, IMF, Interpol, IOC, IOM, IPU, ISO (correspondent), ITSO, ITU, ITUC (NGOs), MIGA, MONUSCO, NAM, OPCW, PCA, SADC, UN, UNCTAD, UNDOF, UNESCO, UNHCR, UNIDO, UNISFA, UNMIL, UNMISS, UNOCI, UNWTO, UPU, WCO, WHO, WIPO, WMO, WTO
International law organization participation
has not presented a declaration of ICJ jurisdiction; recognizes ICCt jurisdiction
Economy
Budget
revenues
$5.388 billion (2021 est.)
expenditures
$6.19 billion (2021 est.)
Exports
Exports 2021
$11.728 billion (2021 est.)
Exports 2022
$12.444 billion (2022 est.)
Exports 2023
$11.454 billion (2023 est.)
Imports
Imports 2021
$7.691 billion (2021 est.)
Imports 2022
$10.022 billion (2022 est.)
Imports 2023
$10.854 billion (2023 est.)
Industries
copper mining and processing, emerald extraction, construction, food products, beverages, chemicals, textiles, fertilizers, horticulture
Labor force
7.407 million (2024 est.)
Public debt
Public debt 2021
71.4% of GDP (2021 est.)
Remittances
Remittances 2021
1.1% of GDP (2021 est.)
Remittances 2022
0.8% of GDP (2022 est.)
Remittances 2023
0.9% of GDP (2023 est.)
Exchange rates
Currency
Zambian kwacha (ZMK) per US dollar -
Exchange rates 2020
18.344 (2020 est.)
Exchange rates 2021
20.018 (2021 est.)
Exchange rates 2022
16.938 (2022 est.)
Exchange rates 2023
20.212 (2023 est.)
Exchange rates 2024
26.166 (2024 est.)
Debt - external
Debt - external 2023
$16.597 billion (2023 est.)
Economic overview
lower-middle-income economy in sub-Saharan Africa; regional producer of hydroelectric power; economic ties and infrastructure investments from China; IMF support for debt restructuring; one of the youngest and rapidly expanding labor forces; pervasive corruption; severe rural poverty
Unemployment rate
Unemployment rate 2022
6% (2022 est.)
Unemployment rate 2023
6% (2023 est.)
Unemployment rate 2024
6% (2024 est.)
Exports - partners
Switzerland 27%, China 15%, India 13%, UAE 12%, DRC 10% (2023)
Imports - partners
South Africa 25%, China 15%, UAE 10%, India 5%, Japan 5% (2023)
Real GDP per capita
Real GDP per capita 2022
$3,600 (2022 est.)
Real GDP per capita 2023
$3,700 (2023 est.)
Real GDP per capita 2024
$3,700 (2024 est.)
Real GDP growth rate
Real GDP growth rate 2022
5.2% (2022 est.)
Real GDP growth rate 2023
5.4% (2023 est.)
Real GDP growth rate 2024
4% (2024 est.)
Agricultural products
sugarcane, cassava, maize, soybeans, milk, vegetables, wheat, groundnuts, sweet potatoes, beef (2023)
Exports - commodities
raw copper, refined copper, gold, precious stones, electricity (2023)
Imports - commodities
refined petroleum, fertilizers, trucks, sulphur, tractors (2023)
Current account balance
Current account balance 2021
$2.63 billion (2021 est.)
Current account balance 2022
$1.093 billion (2022 est.)
Current account balance 2023
-$582.715 million (2023 est.)
Taxes and other revenues
16.8% (of GDP) (2021 est.)
GDP (official exchange rate)
$26.326 billion (2024 est.)
GDP - composition, by end use
household consumption
47.1% (2023 est.)
government consumption
13.3% (2023 est.)
investment in inventories
5% (2023 est.)
investment in fixed capital
26.4% (2023 est.)
exports of goods and services
40.8% (2023 est.)
imports of goods and services
-37.4% (2023 est.)
Population below poverty line
60% (2022 est.)
Inflation rate (consumer prices)
Inflation rate (consumer prices) 2022
11% (2022 est.)
Inflation rate (consumer prices) 2023
10.9% (2023 est.)
Inflation rate (consumer prices) 2024
15% (2024 est.)
Industrial production growth rate
3.5% (2024 est.)
Real GDP (purchasing power parity)
Real GDP (purchasing power parity) 2022
$72.251 billion (2022 est.)
Real GDP (purchasing power parity) 2023
$76.129 billion (2023 est.)
Real GDP (purchasing power parity) 2024
$79.207 billion (2024 est.)
Youth unemployment rate (ages 15-24)
male
10.1% (2024 est.)
total
9.9% (2024 est.)
female
9.6% (2024 est.)
Reserves of foreign exchange and gold
Reserves of foreign exchange and gold 2021
$2.754 billion (2021 est.)
Reserves of foreign exchange and gold 2022
$2.968 billion (2022 est.)
Reserves of foreign exchange and gold 2023
$3.173 billion (2023 est.)
GDP - composition, by sector of origin
industry
37.5% (2024 est.)
services
55.1% (2024 est.)
agriculture
1.8% (2024 est.)
Household income or consumption by percentage share
lowest 10%
1.5% (2022 est.)
highest 10%
39.1% (2022 est.)
Gini Index coefficient - distribution of family income
Gini Index coefficient - distribution of family income 2022
51.5 (2022 est.)
Energy
Coal
exports
15,000 metric tons (2023 est.)
imports
103,000 metric tons (2023 est.)
production
2.091 million metric tons (2023 est.)
consumption
2.081 million metric tons (2023 est.)
proven reserves
945 million metric tons (2023 est.)
Petroleum
refined petroleum consumption
34,000 bbl/day (2023 est.)
Electricity
exports
3 billion kWh (2023 est.)
imports
180 million kWh (2023 est.)
consumption
14.399 billion kWh (2023 est.)
installed generating capacity
3.986 million kW (2023 est.)
transmission/distribution losses
2.229 billion kWh (2023 est.)
Electricity access
electrification - rural areas
14.5%
electrification - urban areas
87%
electrification - total population
47.8% (2022 est.)
Energy consumption per capita
Total energy consumption per capita 2023
8.265 million Btu/person (2023 est.)
Electricity generation sources
solar
0.8% of total installed capacity (2023 est.)
fossil fuels
11% of total installed capacity (2023 est.)
hydroelectricity
87.9% of total installed capacity (2023 est.)
biomass and waste
0.4% of total installed capacity (2023 est.)
Communications
Internet users
percent of population
33% (2023 est.)
Broadcast media
There are 47 television stations in total, both state-operated and privately owned; the state-owned Zambia National Broadcasting Corporation (ZNBC) operates 2 television channels, manages 1, and holds shares in an additional 2 channels; as of 2019, the country has 137 radio stations, comprising 133 private and 4 state-owned.
Internet country code
.zm
Telephones - fixed lines
total subscriptions
81,000 (2023 est.)
subscriptions per 100 inhabitants
(2023 est.) less than 1
Telephones - mobile cellular
total subscriptions
23.2 million (2024 est.)
subscriptions per 100 inhabitants
109 (2024 est.)
Broadband - fixed subscriptions
total
99,000 (2023 est.)
subscriptions per 100 inhabitants
(2023 est.) less than 1
Transportation
Airports
120 (2025)
Railways
total
3,126 km (2014)
narrow gauge
3,126 km (2014) 1.067-m gauge
Heliports
4 (2025)
Merchant marine
total
2 (2023)
by type
general cargo 1, oil tanker 1
Civil aircraft registration country code prefix
9J
Military & Security
Military - note
The Zambia Defense Forces (ZDF) are tasked with safeguarding territorial integrity, ensuring border protection, and supporting peacekeeping missions under African and United Nations mandates; additionally, they hold certain domestic security roles in situations of national crisis and engage in socio-economic initiatives; in recent times, the ZDF has been assigned to aid in agricultural development; the ZDF is integrated into the Southern Africa Development Community (SADC) Standby Force and takes part in joint training exercises; it has benefited from training support provided by both China and the United States.
The ZDF's origins can be traced back to the Northern Rhodesia Regiment, which was established by the British colonial administration to serve during World War II; the formal establishment of the ZDF occurred in 1964, formed from the units of the disbanded Federation of Rhodesia and Nyasaland military forces; it was involved in several regional conflicts throughout the 1970s and 1980s; Zambia played an active role in endorsing independence movements, including the Union for the Total Liberation of Angola (UNITA), the Zimbabwe African People's Union (ZAPU), the African National Congress of South Africa (ANC), and the South-West Africa People's Organization (SWAPO) (2025).
Military deployments
930 Central African Republic (MINUSCA) (2025)
Military expenditures
Military Expenditures 2020
1.2% of GDP (2020 est.)
Military Expenditures 2021
1.1% of GDP (2021 est.)
Military Expenditures 2022
1.1% of GDP (2022 est.)
Military Expenditures 2023
1.3% of GDP (2023 est.)
Military Expenditures 2024
1.3% of GDP (2024 est.)
Military and security forces
Zambia Defense Force (ZDF): Zambia Army, Zambia Air Force, Zambia National Service.
Ministry of Home Affairs and Internal Security: Zambia Police (2025).
Military service age and obligation
Individuals between 18 and 25 years of age (17 with parental permission) can voluntarily enlist in military service, with no conscription in place; the initial commitment is set for 7 years, followed by an additional 5 years in the Reserves (2025).
Military equipment inventories and acquisitions
The inventory of the ZDF predominantly consists of weapons and equipment sourced from China, Russia, and Soviet-era supplies, along with smaller amounts of materials from alternative suppliers such as Israel, South Africa, and the United States (2025).
Military and security service personnel strengths
approximately 16,000 active Defense Forces (2025)
Transnational Issues
Refugees and internally displaced persons
IDPs
131,349 (2024 est.)
refugees
88,918 (2024 est.)